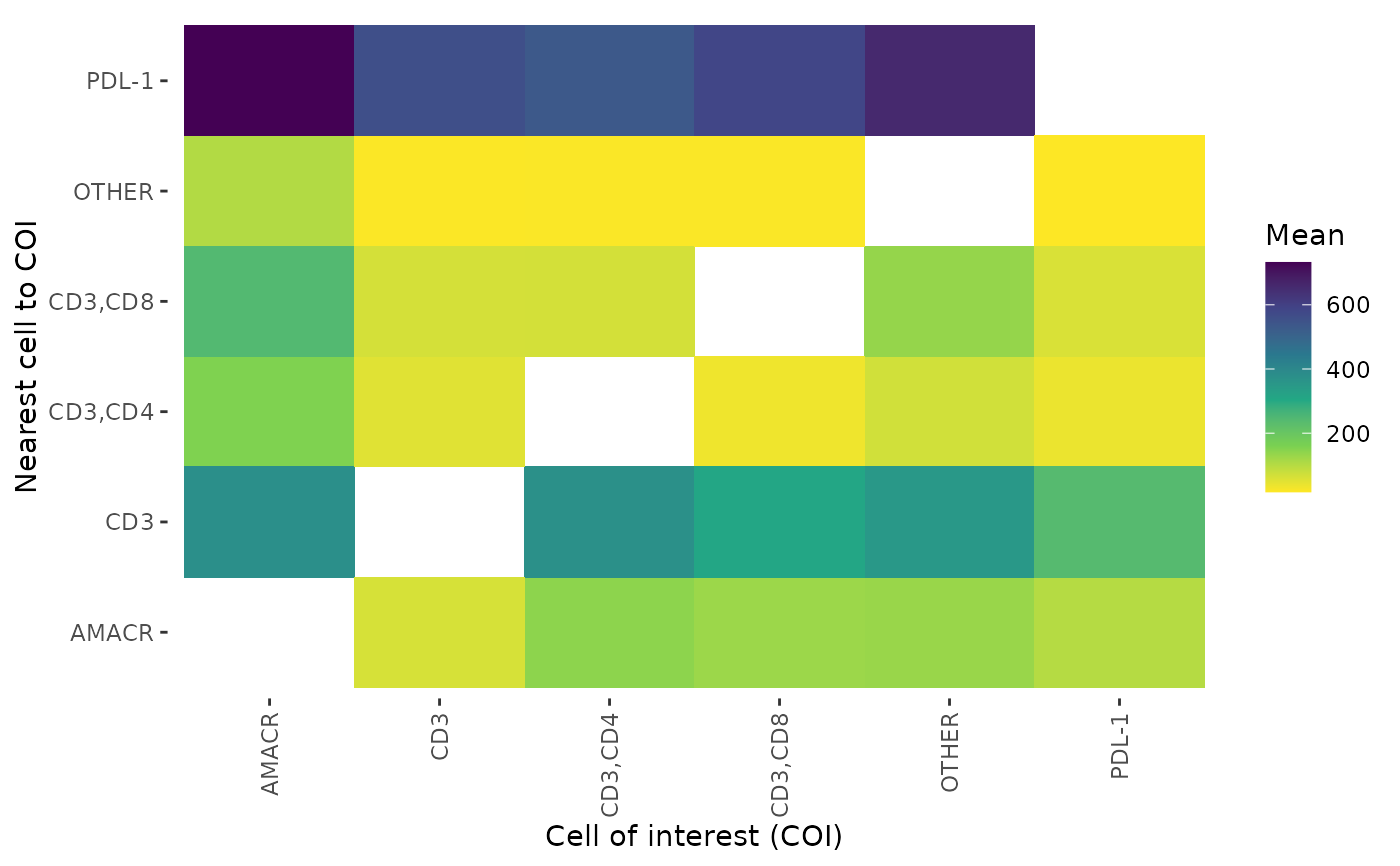
Takes the output of cell_distances and plot the distances as a heatmap
plot_distance_heatmap(phenotype_distances_result, metric = "mean")
Arguments
| phenotype_distances_result | Dataframe output from calculate_distances_between_phenotypes |
|---|---|
| metric | Metric to be plotted. One of "mean", "std.dev" or "median". |
Value
A plot is returned
Examples
#> [1] "All markers are used in pair-wise distance calculation: " #> [1] "OTHER" "AMACR" "CD3,CD4" "CD3,CD8" "CD3" "PDL-1"plot_distance_heatmap(summary_distances)
