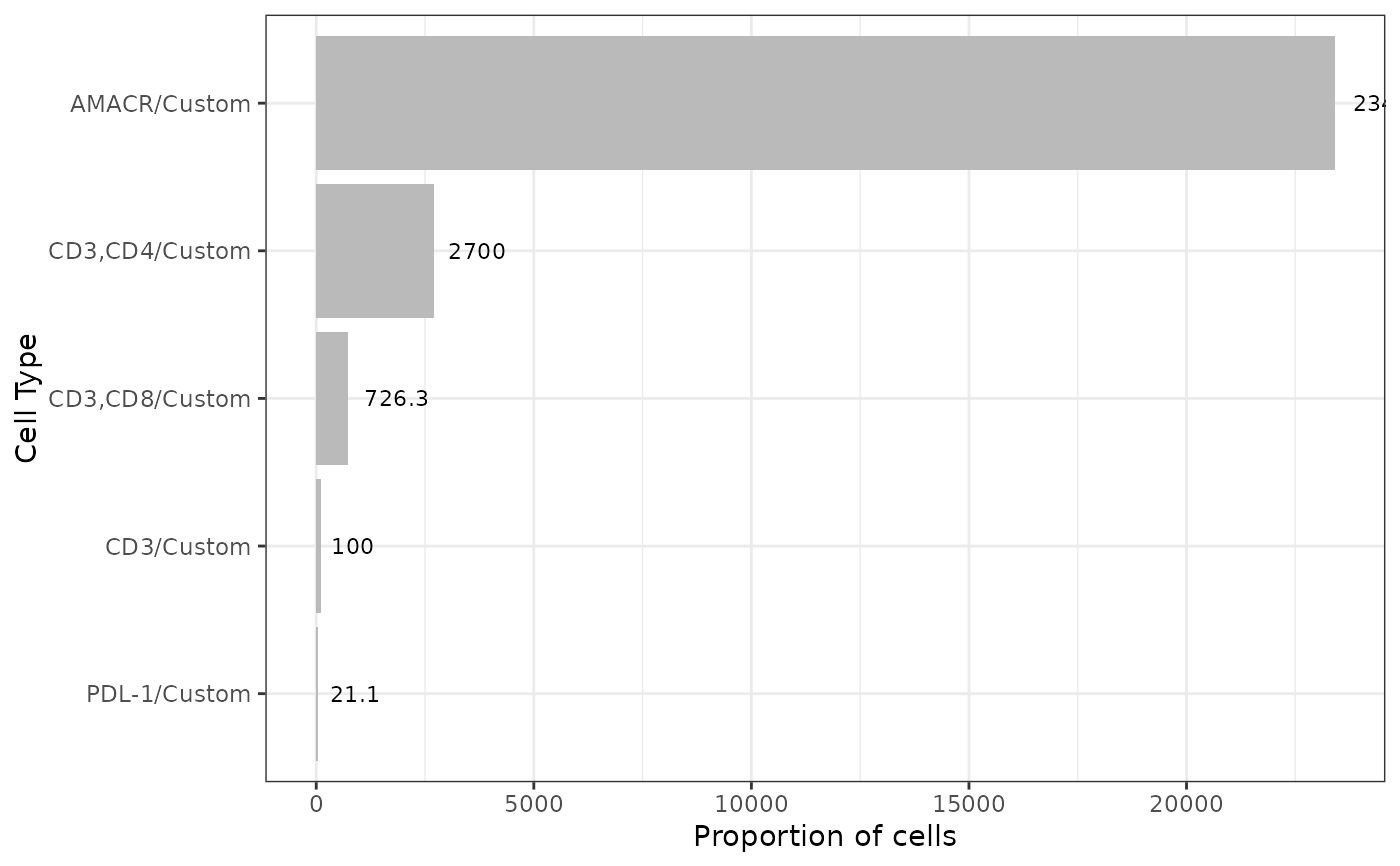
Plots cells proportions as barplots
plot_cell_percentages(
  cell_proportions,
  tumour_marker = NULL,
  cellprop_colname = "Proportion_name"
)
Arguments
| cell_proportions | Output from calculate_cell_proportions |
|---|---|
| tumour_marker | Tumour marker to exclude if needed |
| cellprop_colname | Column to use for y axis names. Default is "Proportion_name" |
Value
A plot is returned
Examples
p_cells <- calculate_cell_proportions(SPIAT::formatted_image, reference_celltypes=c("Total", "CD3"))
plot_cell_percentages(p_cells)
