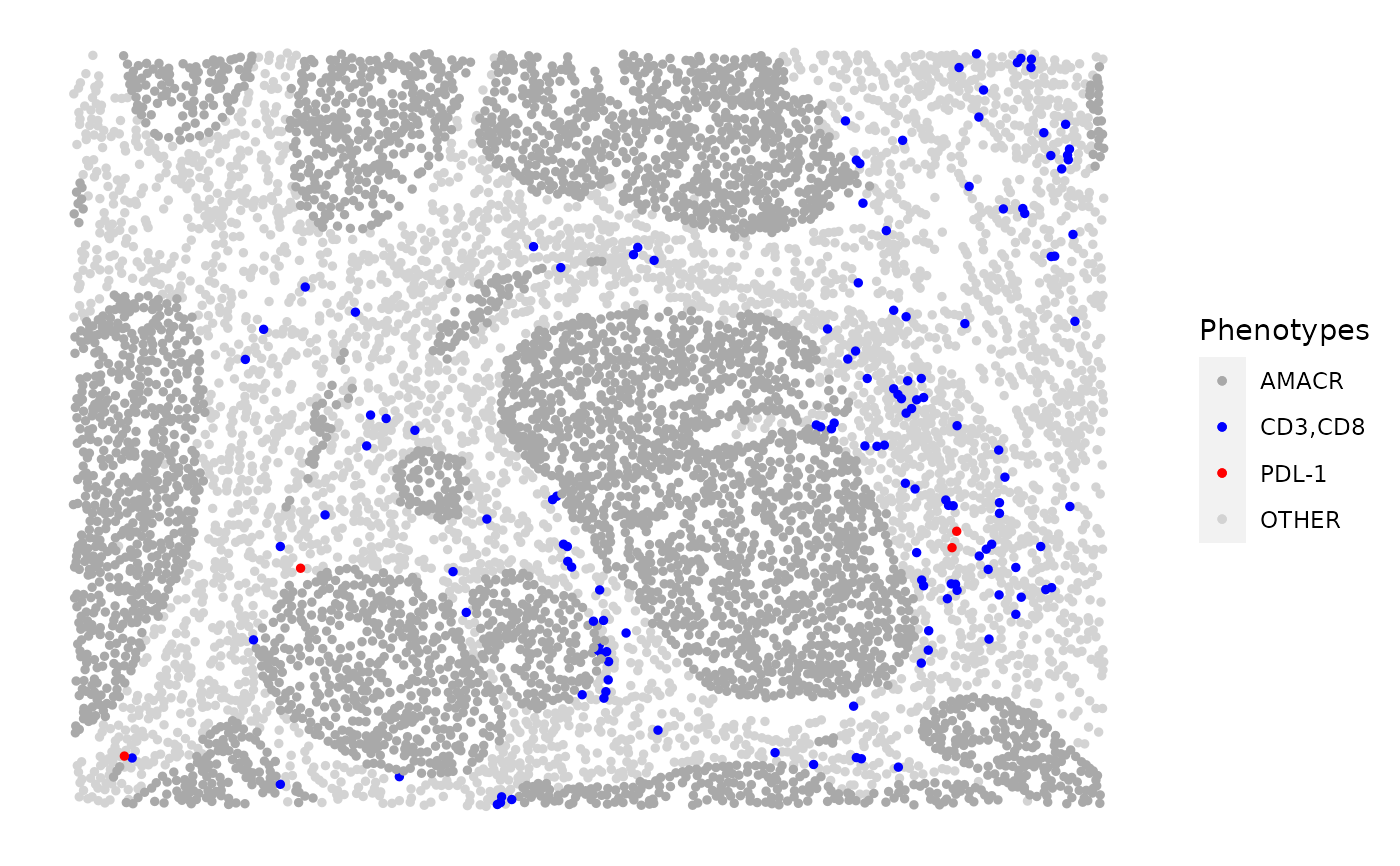
Produces a scatter plot of the cells in the tissue. Cells are coloured categorically by phenotype. Cells not part of the phenotypes of interest will be coloured "lightgrey"
plot_cell_categories(sce_object, phenotypes_of_interest, colour_vector)
Arguments
| sce_object | Singlecellexperiment object in the form of the output of format_image_to_sce |
|---|---|
| phenotypes_of_interest | Vector of cell phenotypes to be coloured |
| colour_vector | Vector specifying the colours of each cell phenotype |
Value
A plot is returned
Examples
phenotypes_of_interest <- c("AMACR", "CD3,CD8", "PDL-1")
colour_vector <- c("darkgrey", "blue", "red")
plot_cell_categories(SPIAT::formatted_image, phenotypes_of_interest, colour_vector)
