measure_association_to_cell_properties
Source:R/measure_association_to_cell_properties.R
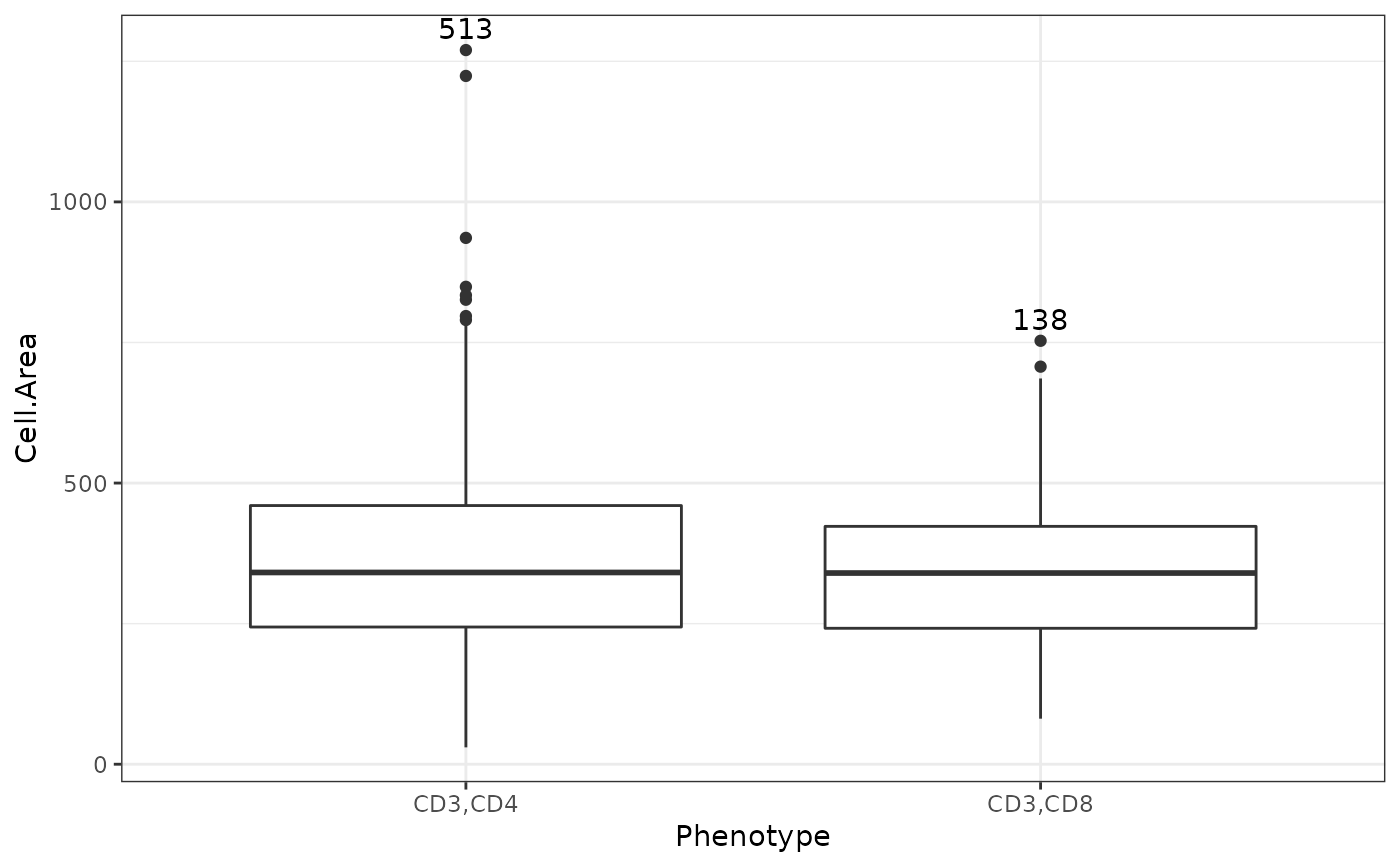
measure_association_to_cell_properties.RdPlots the density or boxplot of a property of two cell phenotypes or compares using t test/wilcoxon rank sum test
measure_association_to_cell_properties(
  sce_object,
  property = "Cell.Area",
  phenotypes,
  merge = NULL,
  merge_name = NULL,
  method = "density",
  Nucleus.Ratio = FALSE,
  log.scale = FALSE
)
Arguments
| sce_object | SingleCellExperiment object in the form of the output of format_image_to_sce |
|---|---|
| property | String that is the name of the column of interest |
| phenotypes | Vector of phenotypes of interest |
| merge | Vector of phenotypes to be merged |
| merge_name | String that is the name of the merged phenotype |
| method | the analysis to do on the selected phenotypes and property. Options are density, box, t, wilcox |
| Nucleus.Ratio | when the ratio of the nucleus size is of interest |
| log.scale | if log the data |
Value
With method "box" or "density a plot is returned. With method "t" or "wilcox", the text output from the test are returned.
Examples
measure_association_to_cell_properties(SPIAT::formatted_image, phenotypes = c("CD3,CD4", "CD3,CD8"), property = "Cell.Area", method = "box")measure_association_to_cell_properties(SPIAT::formatted_image, phenotypes = c("CD3,CD4", "CD3,CD8"), property = "Cell.Area", method = "t")#> #> Welch Two Sample t-test #> #> data: CD3,CD4 and CD3,CD8 #> t = 2.1766, df = 259.32, p-value = 0.03041 #> alternative hypothesis: true difference in means is not equal to 0 #> 95 percent confidence interval: #> 2.783879 55.630562 #> sample estimates: #> mean of x mean of y #> 369.1637 339.9565 #>
