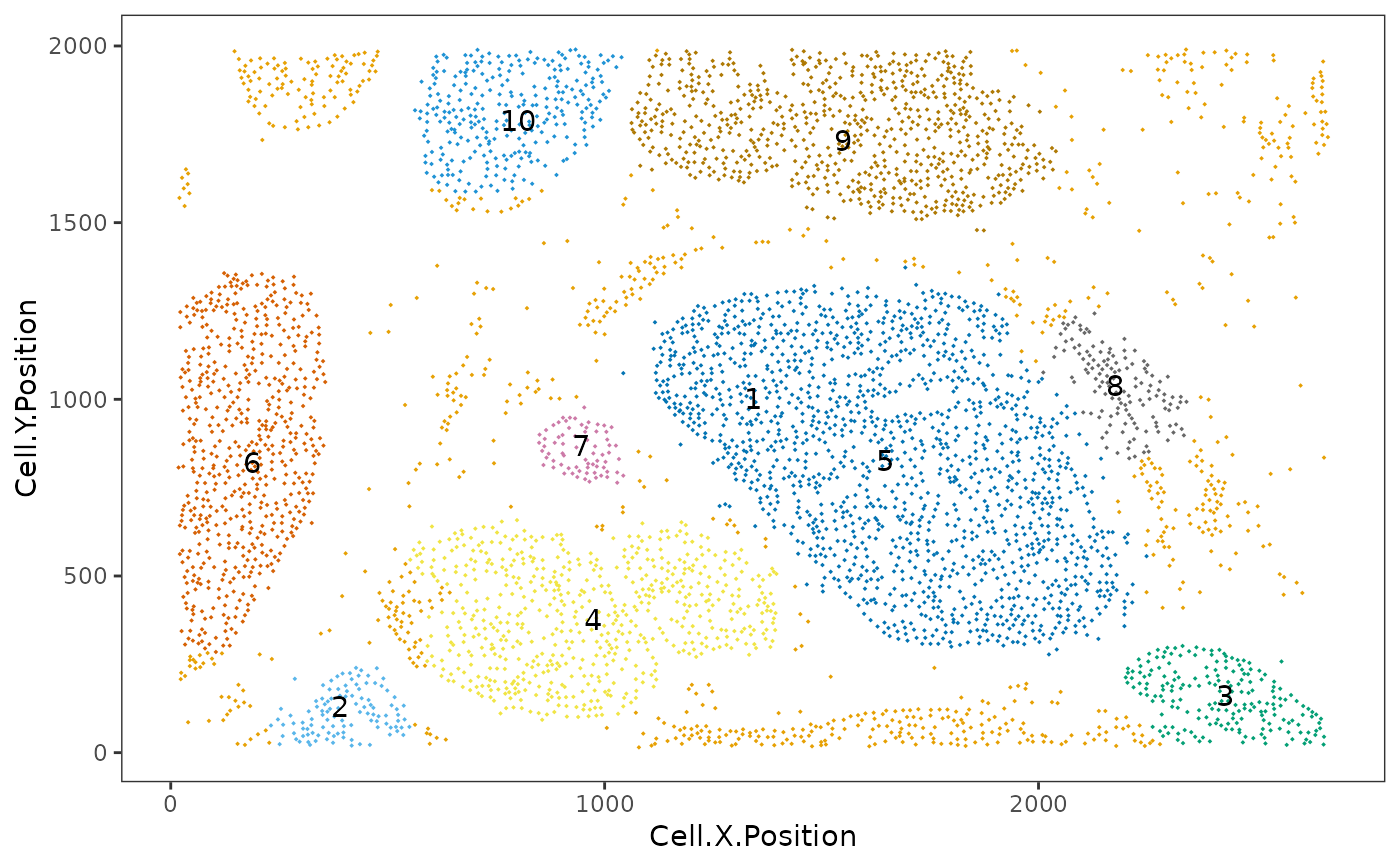
composition_of_clusters_and_communities
Source:R/composition_of_clusters_and_communities.R
composition_of_clusters_and_communities.RdReturns a dataframe which contains the percentages of cells with a specific marker within each cluster and the number of cells in the cluster.
composition_of_clusters_and_communities(
  formatted_data_with_clusters,
  type_of_aggregate,
  column
)
Arguments
| formatted_data_with_clusters | - a dataframe output from generate_clusters |
|---|---|
| type_of_aggregate | Cluster or Community |
| column | Column with cell types |
Value
A data.frame is returned
Examples
communities_vis <- composition_of_clusters_and_communities(communities, type_of_aggregate = "Community", column="Phenotype")
